We live in a world flooded by data. From the daily weather report, opinion polls, or what’s trending on social media, all that information comes from data. As educators, it is important we build our students statistical literacy. We want to build students’ data sense and see that data is more than just numbers. They can use statistics to convert those numbers into valuable information. One way to do this is by teaching data and graphing in the primary classroom and eliciting rich discussions about the data.

The progression of data and graphing K-2
In primary classrooms, there is a progression of the data and graphing standards. Pre-K and K students learn how to categorize data by sorting them into different groups. In first and second grades, students learn how to come up with a question, collect data, organize it, and represent it in a bar graph or pictograph. Second graders also incorporate the use of graphing measurement on line plots. No matter which type of graph is used, students should interpret the data in the context of real questions. This will build their statistical literacy.
Data Sense: Doing Math vs. Doing Statistics
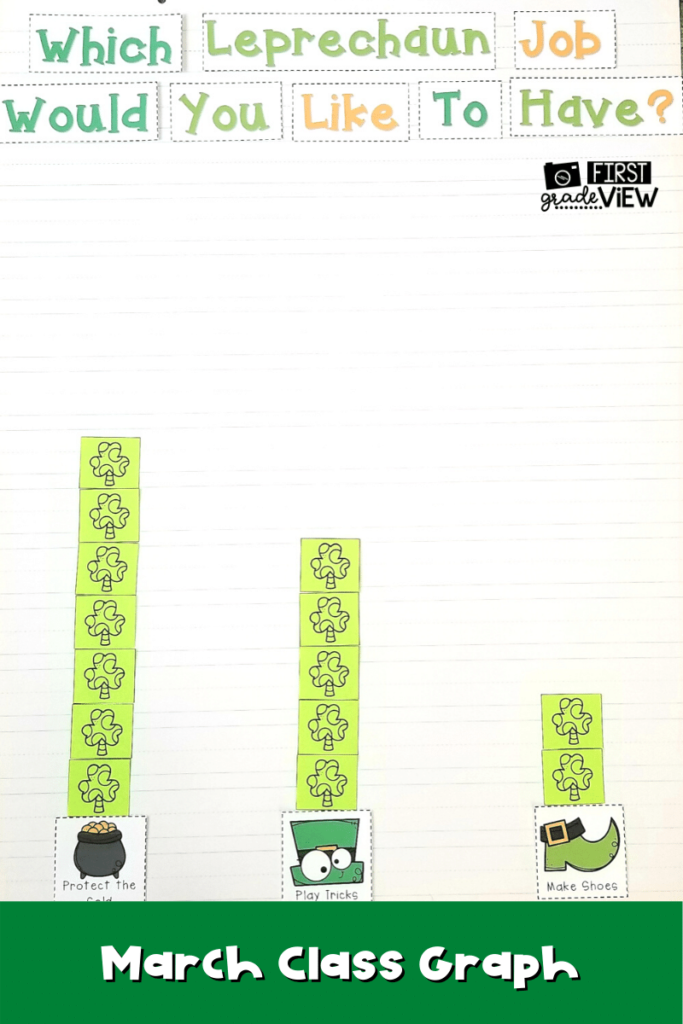
Many times, when teaching data and graphing in the classroom, the questions presented to students focus on “doing math.” These questions focus on the numbers and their operations. Take a look at the graph below:

The question, “How many more students chose protecting the pot of gold than making shoes?” focuses on doing math. In order to solve, students need to operate on the numbers. For example, 9-7=2.
In addition to “doing math” students must also “do statistics.” Statistical thinking requires analysis. Consider the following questions. “Which job does the head leprechaun need to advertise better to get more leprechaun interested? How do you know?” These questions not only require students to do math by counting each category, students must also interpret the data in the context of a real question. I always like to tell my students that people collect data for a specific reason. When you interpret the data, you can use it to help you. In this case, the head leprechaun may need to make the shoemaking job more enticing.
Teaching Graphing: Importance of Questions
When making graphs with your students, make sure you don’t focus solely on graph construction. Instead focus on both math and statistical analysis questions. Two important questions to ask are, “What information can the graph NOT tell us? and “If we were to ask this question to the class next door, would we get the same results? Why or why not?” Remember, we want students to see that graphs do not always show the entire picture. They only represent a select sample of participants and may only show certain information. You will be amazed at the math discussion that comes out of questions designed to analyze the data!

Getting Started on Teaching Graphs in the Classroom
If you would like to teach data and graphing in your classroom, you will want to begin with a survey question. A great place to begin is with questions about your students. You can ask them about their favorites- food, animal, sport, etc. Questions that have number responses also work well. For example, number of letters in their name, numbers of pets, etc. You can also ask them measurement questions such as the length of their foot in unifix cubes. Your students are also great resources in terms of coming up with questions. If you are interested in ready to go graphs to use with your students, be sure to check out the graph activities in my TpT store.
Once you have your survey questions, you and your students can collect the data and decide how you want to represent it. After constructing your class graph, remember to spark discussions where students must do math and do statistics. If you are looking for more ideas how to do this, be sure to check next week’s blog post where I will go into detail about how I use graphs each week in my first grade classroom. Now that you know the importance behind teaching data and graphing in the primary classroom to build statistical literacy, give it a try and let me know how it goes!
If you are teaching remotely, you may be interested in my blog post with tips for distance learning.


