Using graphs for first grade can help build your students’ statistical literacy and be lots of fun! In first grade, students work on representing and interpreting data. During the month of October, I like to tie in graphs around some of our favorite read alouds. Here are three spooktacular Halloween graphs for first grade.
Pumpkin Graph
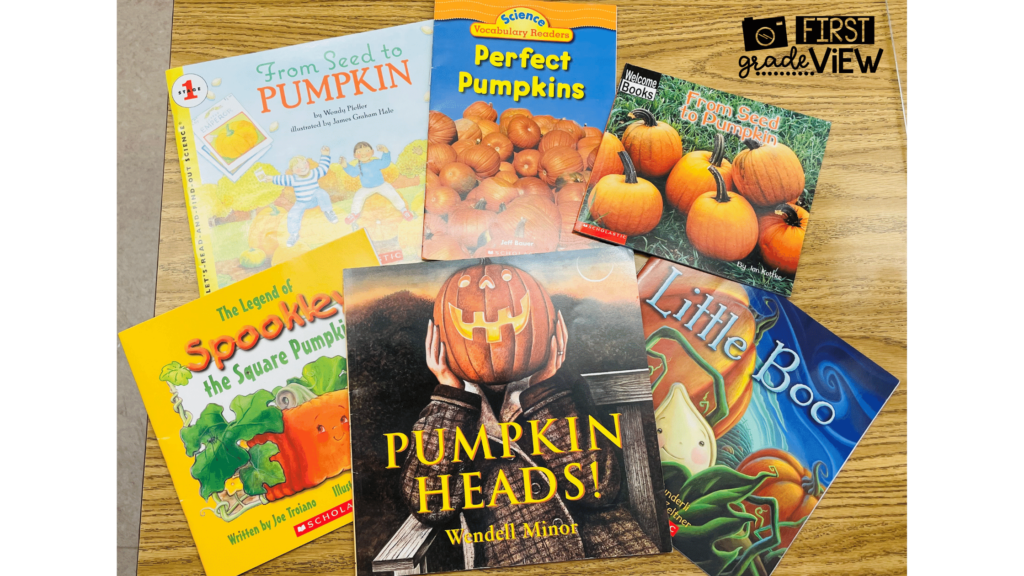
At the start of fall, my students study pumpkins. We immerse ourselves in nonfiction and fiction books about pumpkins. My students especially love the books The Legend of Spookley the Square Pumpkin by Joe Troiano, Little Boo by Stephen Wunderli, and Pumpkin Heads by Wendall Minor. After reading our books, we create pumpkin poems, write new facts we have learned, and even do some pumpkin science! It’s so much fun!
After learning about pumpkins, I like to poll my students. I ask them if they had a pumpkin, which kind of face would they carve- spooky, silly, or happy? Students love to interact with the pumpkin graph and see the selection of their peers.
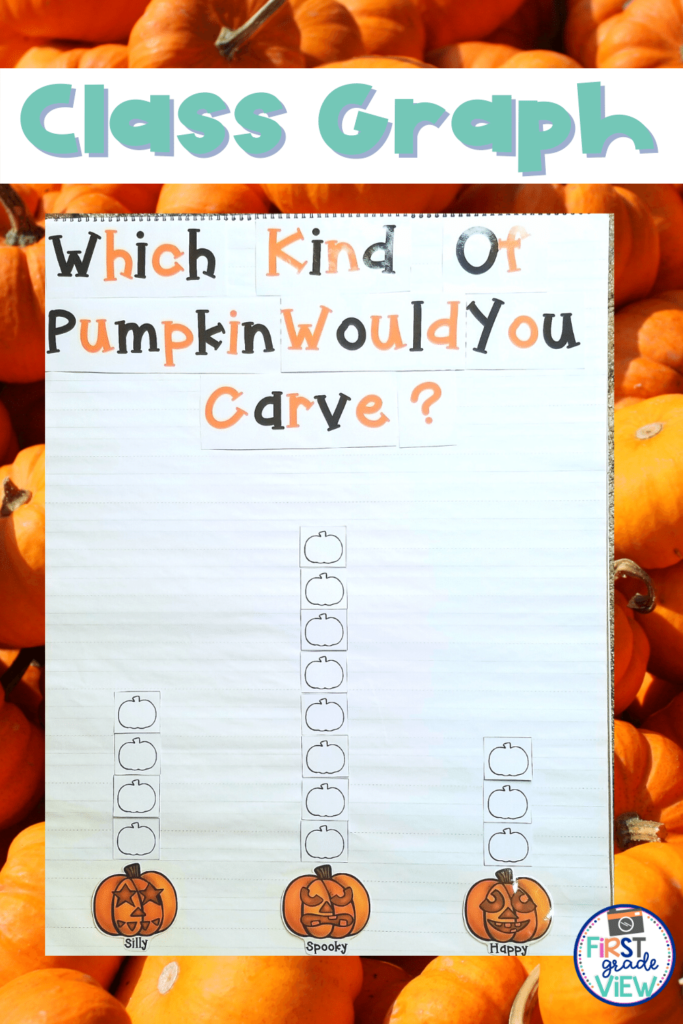
Once our class graph is complete, I have my first graders engage in data math talks. During this time, we focus on questions related to statistical analysis. I remind my students that data is collected for a purpose. I try to incorporate questions on how this data could be used in the real world.
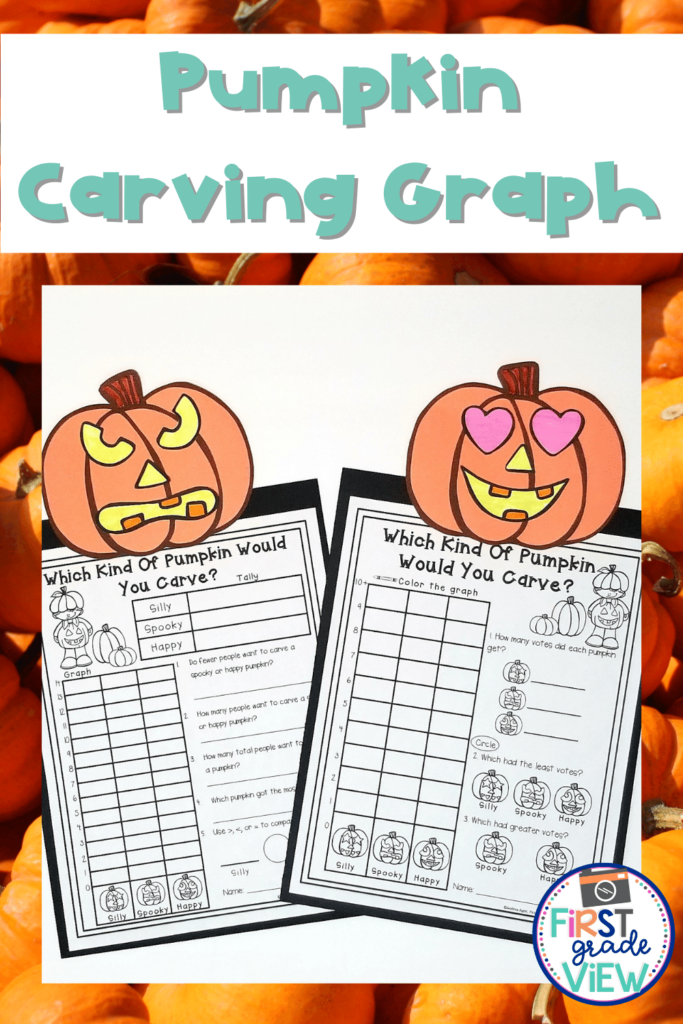
Then, students complete their own pumpkin carving graph. I love that I can differentiate the graphs based on the needs of my students. This allows them to work on the same content at their just right level. Students enjoy making their pumpkin topper and these graphs make for a spooky bulletin board!
Halloween Characters Graph
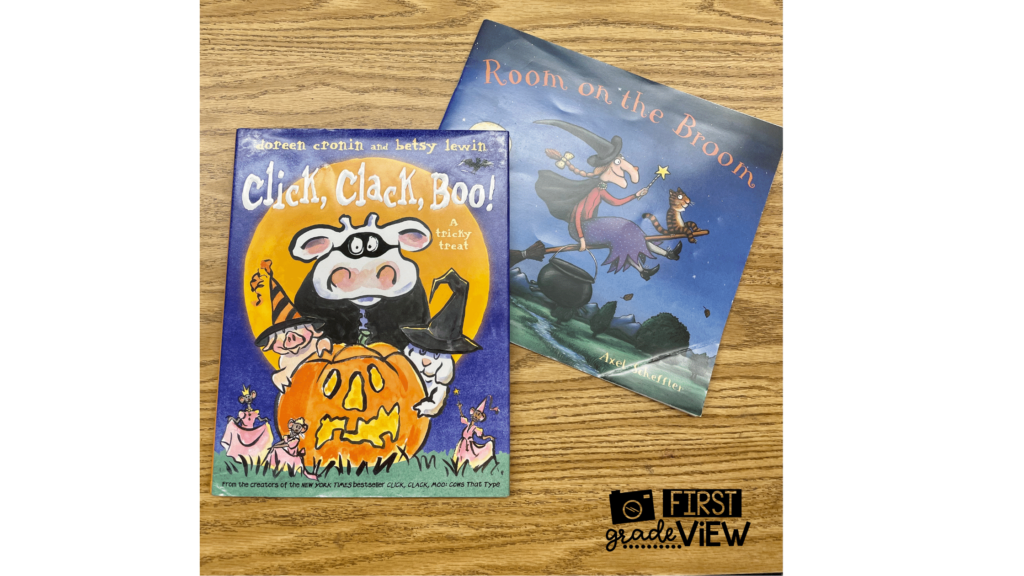
Halloween themed graphs for first grade are also very popular during the month of October. Some of my students’ favorite books to read are Room on the Broom by Julia Donaldson, Frankenstein Doesn’t Wear Earmuffs by John Loren, and Click Clack Boo by Doreen Cronin and Besy Lewin.
After hearing the stories, I poll my students on which Halloween character they would like to meet- Dracula, Frankenstein, or a Witch? After making our class graph, students get to make their own graph.
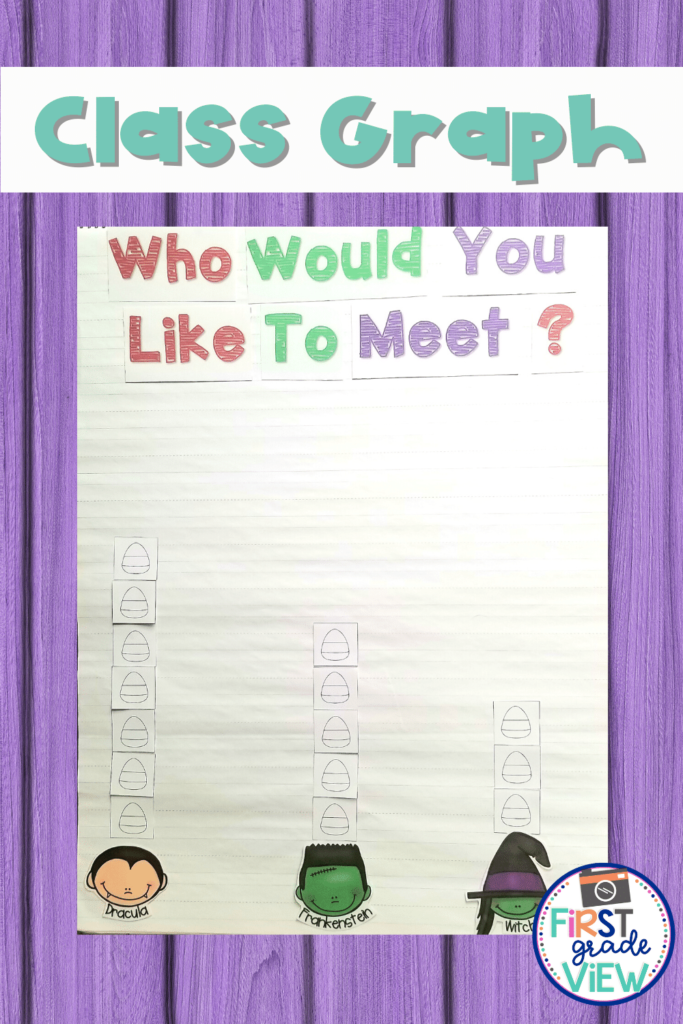
Afterwards, I engage my students in a rich math discussion about the data. This is so important because in addition to building students’ number sense, we also want to build their data sense. For example, I might ask, “Your class gets to interview a Halloween character. Which character should your class invite? Why?”
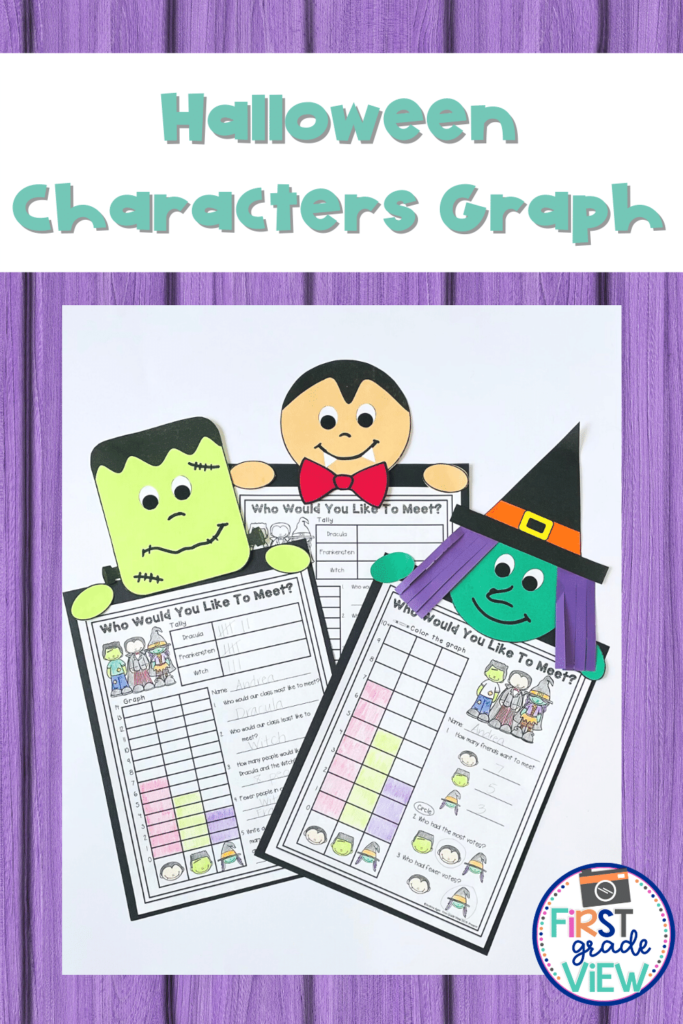
After our data discussion, I have my students complete their own Halloween characters graph. We work on making tally marks and review how to construct a bar graph. I love that I don’t have to wait until we get to the graphing unit in our math curriculum to expose my students to collecting and interpreting data. The students also love making the special topper to go along with their graph.
Trick or Treater Graph
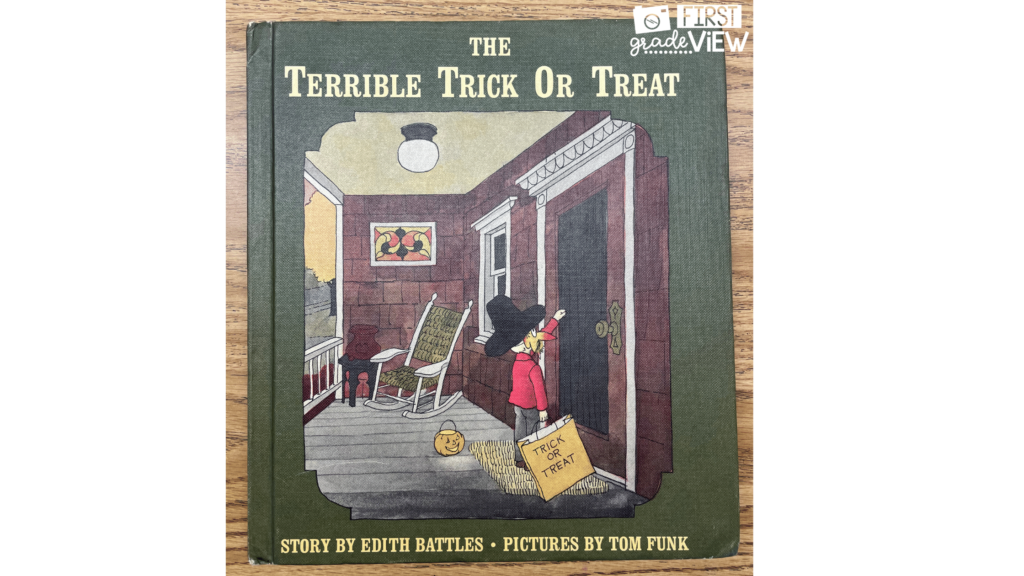
As Halloween gets closer, many of my students start talking about what they want to dress up as. If my entire class celebrates Halloween, we usually make a trick or treater graph at the end of the month. Our favorite trick or treat read alouds are The Terrible Trick or Treat by Edith Battles and Trick or Treat Little Critter by Gina and Mercer Mayer.
After listening to our stories, I poll my students on what they like best about Halloween- candy or costumes? This poll usually brings about a very interesting discussion.
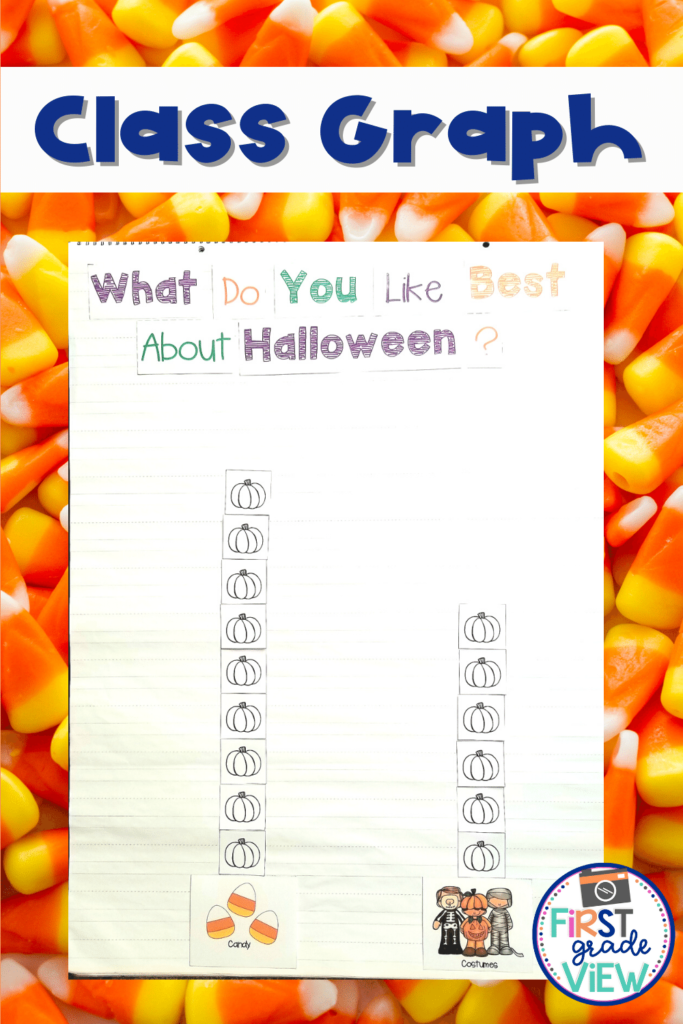
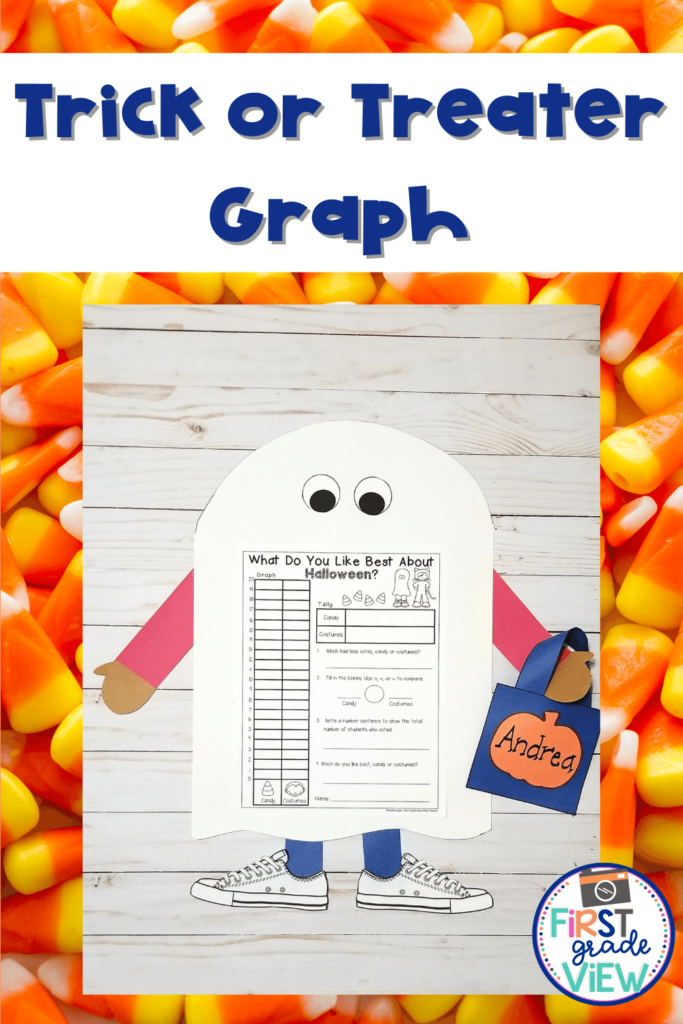
Once our poll is complete, students get to create their own Trick or Treater bar graph. This provides students the opportunity to work on building a graph and reading data. By using graphs throughout the year, students have a pretty good data sense by the time we get to our graphing unit.
Since the graph worksheet focuses on doing math, I also like to have a data talk with my students. During our data talk, students answer questions about doing statistics and involve critical thinking.
After our discussion, students are ready to create their very own trick or treater! They enjoy incorporating art with what they have learned in math. It’s so much fun!
If you are interested in getting started with graphs in your classroom, check out my Tpt store. You can also find all 3 of these Halloween graphs HERE!
You may also like
The High Impact of Teaching Data and Graphing in the Primary Classroom

No Comments